
Understanding Azure Monitor
Azure Monitor is a powerful alerting and monitoring tool from Microsoft Azure. Azure Monitor provides a comprehensive solution for gathering, evaluating, and interacting with telemetry from the user’s cloud and on-premise settings, maximizing the supply and performance of your apps and services.
What is Azure Monitor?
Azure Monitor is a cloud-based service that provides monitoring, alerting, and diagnostics capabilities for your applications in Azure. It’s easy to set up and use, so you can get started in minutes, then add more stuff as needed.
With Azure Monitor, you get:
- Monitoring of your Azure resources
- Alerts and notifications for events that may require action
- Diagnostics for troubleshooting problems in your application
- Observability into the health of your environment through rich dashboards and logs
- The ability to understand trends over time
The platform has a powerful analytical engine and an interactive query language, and it is scalable cost- and performance-optimized. While offering inbuilt machine-learning capabilities, Azure Monitor connects with numerous technologies in DevOps, IT service and issue management, security information, and event management.
Azure Monitor Working
Azure Monitor collects monitoring data from various on-premises and Azure resources. Log data is pushed to Azure Monitor by management tools included in Azure Automation and Azure Security Center. It gathers and stores the telemetry in the performance- and cost-efficient log data store. To find and fix issues, analyze data, get complete visibility of your application, set up alarms, and apply machine learning-driven insights.

Metrics
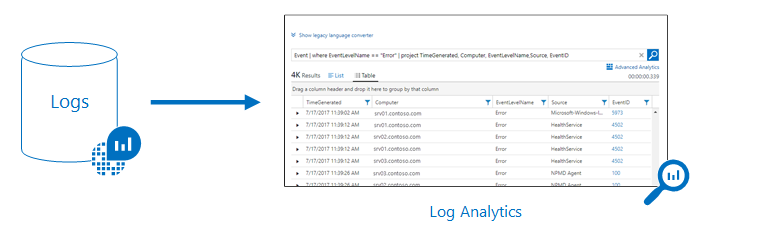
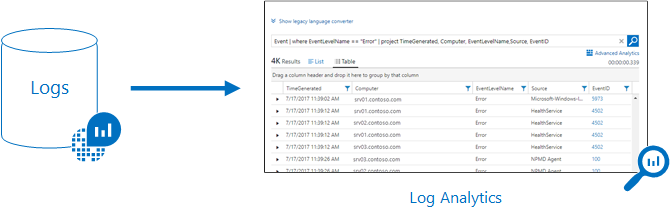
The Azure Monitor logs contain events, performance information, traces, and other information about a given application. They can be accessed through the Log Analytics workspace, which enables a robust query language for analysis, and are either structured or text-free.

Logs
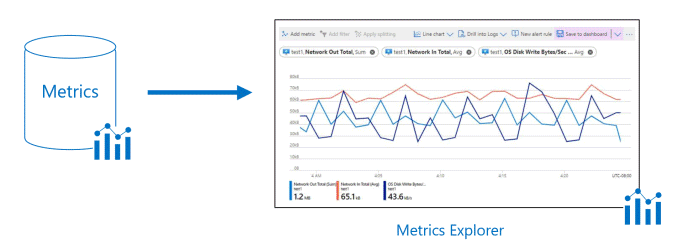
The properties of a resource are measured over time via Azure monitor metrics. Metrics are quantitative data that describe many characteristics, such as CPU consumption, memory usage, network usage, etc. The metrics explorer can be used to analyze these interval-stored real-time measurements. Since they are kept in a time-series database, it is appropriate to see them as graphs.
What Data does Azure Monitor Collect?

Azure Monitor provides two main types of telemetry data:
- Subscription Data – This includes all data related to your subscriptions like usage, cost, and billing information. You can configure how much or how little detail you want to see here.
- Resource Data – This includes resource usage data such as CPU, storage and network performance metrics for your running instances.
- Application Data – This includes application-specific telemetry data like custom metrics from your applications running on Azure.
- Guest OS Data – This includes guest operating system telemetry data like events from the guest operating systems running on Azure virtual machines.
Insights in Azure Monitor
Analyzing monitored data most effectively requires visualization. Using insights, you can customize Azure monitoring and research data efficiently.
Container Insights
Kubernetes clusters’ workloads can be monitored with container insights. Container insights collect data from Azure Kubernetes containers, as well as container logs, to visualize performance.
VM Insights
Monitoring Azure virtual machines (VM) is possible through VM insights. Windows and Linux VMs are analyzed, and interdependencies between various processes are identified. A VM hosted on-premises or in another cloud can be monitored, and independencies can be examined using VM insights.
Application Insights
You can monitor various web applications’ performance, availability, and usage with Application Insights. With Azure monitor, you can gain a deeper understanding of the application’s operations and diagnose errors before users report them. Visual Studio Integration and DevOps Integration are possible with Applications Insights.
How does Microsoft Positions Azure Monitor?
Knowing Azure Monitor is the hub for all monitoring toolkits is helpful for beginners. It is advised to develop the habit of always starting with Azure Monitor, regardless of whether you want to look at metrics, Application Insights, etc.
Microsoft intends to make Azure Monitor the default starting point for all Azure monitoring toolkits. A few other monitoring toolkits have been combined or integrated into Azure Monitor.
Best Practices for Continuous Monitoring with Azure Monitor
With Azure Monitor, you can monitor your Azure resources and applications. You can also set up notifications, alerts, and dashboards to see the status of your apps in real-time.
Monitor All Applications
A key practice is to monitor all applications from a single pane of glass. You can create and add a custom resource group with all your applications. This lets you view your application metrics, logs, and errors in one place.
Enable Logging
Another best practice is enabling logging into all of your applications. This gives you visibility at the application level and lets you identify issues that might span multiple silos within an organization.
Set Up Effective Notifications
Another best practice is setting up notifications when something goes wrong with any resource within an application or across multiple applications.
Conclusion
Microsoft Azure Monitor provides a unified platform for tracking and keeping tabs on the efficiency of your apps, systems, and the resources they rely on. Aside from employing custom log queries and integrating Azure Monitor with numerous other systems, you may also gain from bespoke performance tracking.
At Awsom LLC, you can connect with cloud experts to ensure your data is safely stored in the cloud. The team of specialists will assist you in identifying the right cloud service for your business and handle all the necessary development tasks.