
Creating and Analyzing Metrics and Alerts
For your services to be reliable and stable, it is crucial to understand the condition of your infrastructure and systems. Your team can react to problems more quickly and with more security if they have information about the health and performance of your deployments. A strong monitoring system that collects metrics, visualizes data, and notifies operators when something seems broken is one of the greatest methods to get this insight.
This guide will review the metrics and alerting definitions in Azure.
Metrics and Alerting in Azure
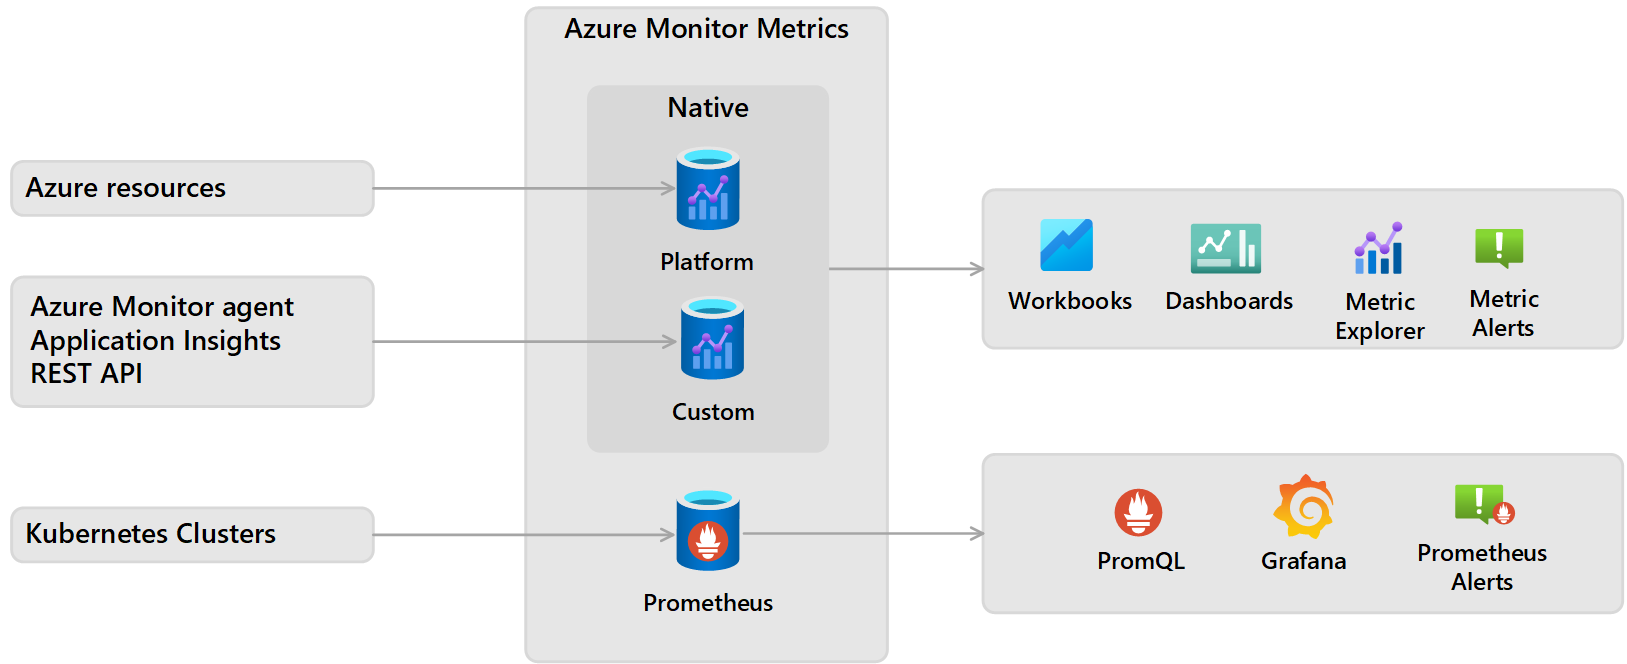
Azure Monitor Metrics compiles numerical information from resources being watched into a time-series database. These numerical measurements are taken regularly to characterize certain system elements at specific intervals. Metrics from Azure Monitor are ideal for alerting and problem detection since they are lightweight and can handle real-time scenarios.
Metrics Explorer alerts you in advance and allows you to study them. You can also see them in a dashboard or worksheet. Azure Monitor metrics may enable near-real-time scenarios and are lightweight. They help alert and quick issue detection for these causes. One can:
- When a value exceeds a threshold, get an alert beforehand.
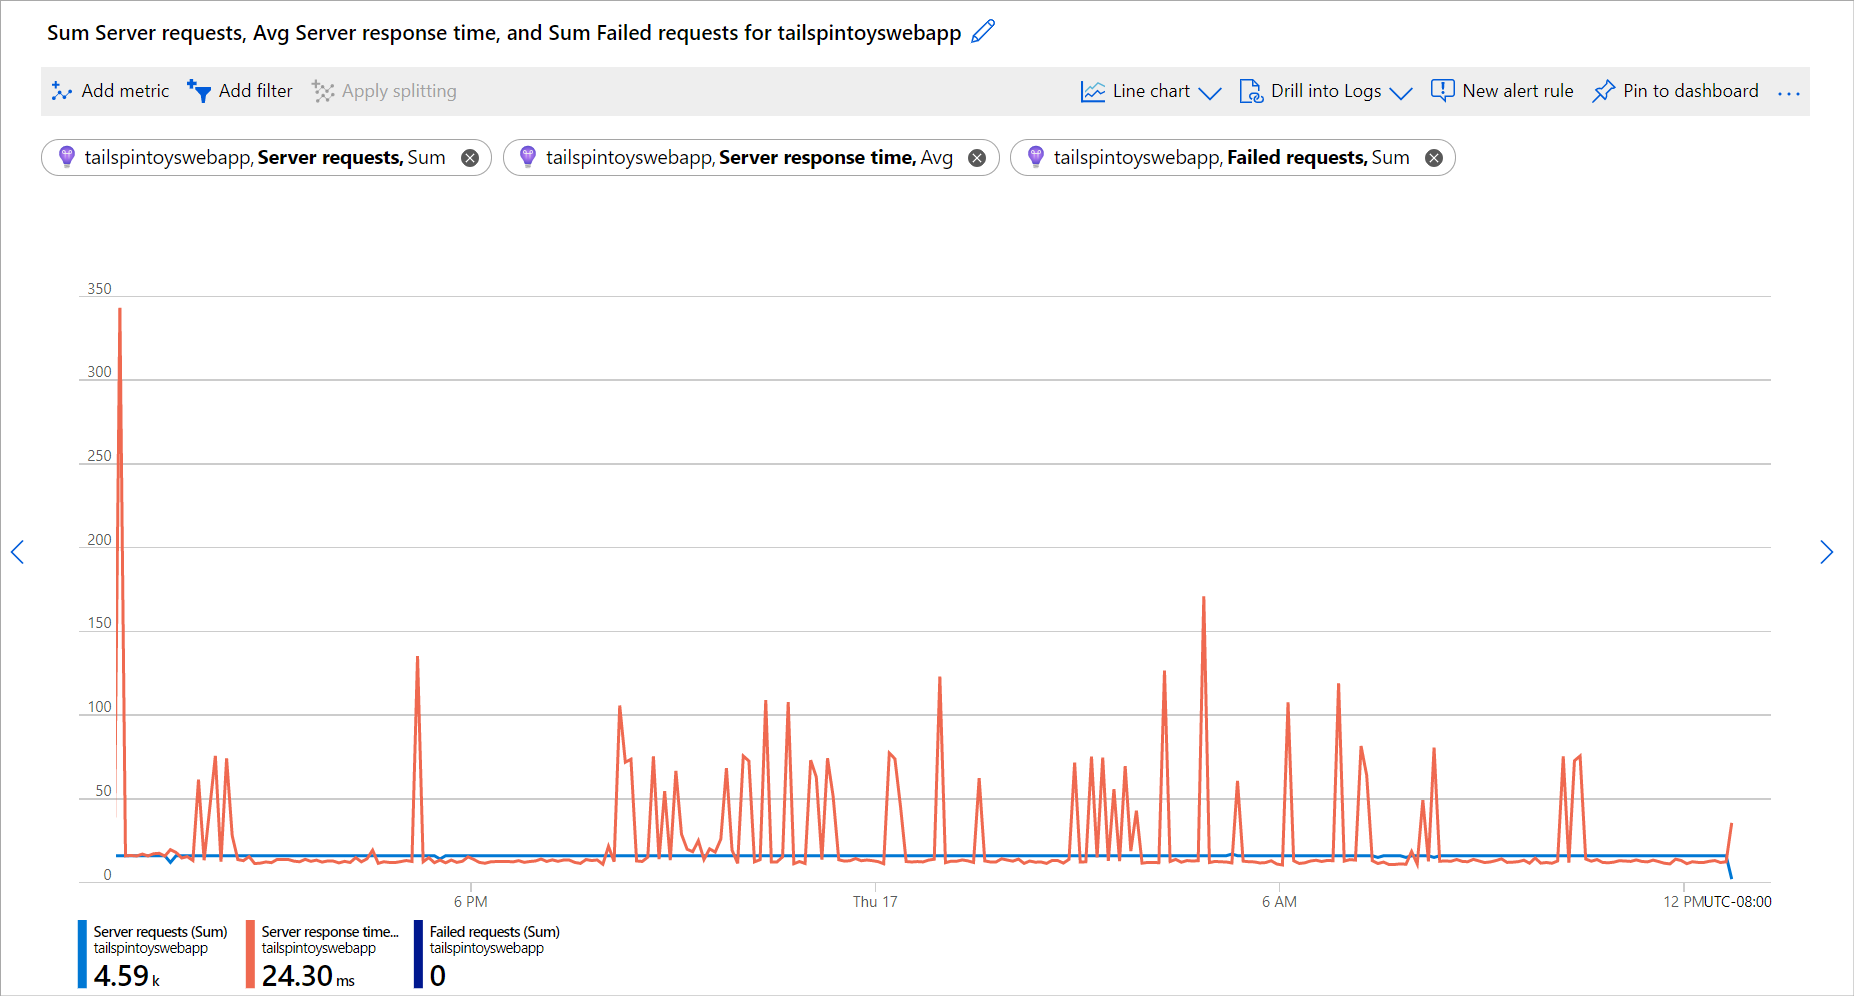
- Utilize the Metrics Explorer to analyze them interactively.
- Create a worksheet or dashboard to represent them.

Creating a Metric Alert Rule with Azure Portal
- In the Azure Portal, select Monitor.
- Then click Add New alert rule under Alerts.
- Select a target resource by clicking Select Target in the context pane. Utilize the dropdown menus for Subscription and Resource types to find the necessary resources.
- The available signals will include metrics for which you can set alerts if the chosen resources provide them.
- Once you have decided on the target resource, click Add condition.
- Pick the metric on which you want an alert to be created from the list of signals supported for resources.
- To view a longer history for the metric, use the Chart period dropdown.
- If the metric has dimensions, a dimension table will be displayed. Choose a value or value for each dimension.
- Choose the Operator, the Threshold type, and the Aggregation type.
- The condition can be more precise by modifying the Aggregation granularity and Frequency of evaluation.
- Select “Done“
- Add more criteria to monitor a complicated alert rule (if you want).
- Indicate the rule name, severity, and description for the alert.
- You can add an action group by choosing an existing one or establishing a new one.
- To save the metric alert rule, click Done.
What can you do with Azure Monitor Metrics?
Azure Monitor Metrics can help you identify and diagnose your application performance issues. It provides the following capabilities:
Data collection
Azure Monitor Metrics collects metrics from Azure services, such as virtual machines (VMs), web apps, virtual networks (VNETs), SQL databases, and more. You can configure Azure Monitor Metrics to collect metrics from multiple services into one unified view. The collected data is stored for up to 90 days in an Azure Storage account by default. If your subscription does not include sufficient data storage space, you can extend the free tier by purchasing additional storage capacity from the Azure Marketplace.
Metrics Explorer
Metrics Explorer provides a consolidated view of all metrics collected from your different resources. You can use it to see how your apps perform across multiple dimensions, such as time of day or geography. You can also search for specific events or periods within the data for deeper analysis.

Data Structure
In addition to providing rich query capabilities, Azure Monitor Metrics also includes data structures that allow you to analyze trends over time, so you can understand how resource utilization changes over time. For example, if you’re tracking CPU utilization over time, you might want to know what percentage of CPU was utilized by each virtual machine during each hour.
Multi-dimensional Metrics
Azure Monitor Metrics provides a multi-dimensional view of your resources. It allows you to collect metrics from different dimensions, such as resource group, subscription, VM size, role type, etc., to precisely correlate other metrics and identify performance issues.
Metrics Retention
Platform metrics are kept for 93 days for the majority of Azure resources. A few things are an exception:
- Guest OS Metrics Collected by the Log Analytics Agent: These performance counters are gathered and forwarded to a workspace in Log Analytics. These measurements have a 31-day retention period that can be increased to 2 years.
- Application Insights Log-based Metrics: Log queries are the technical term for log-based metrics. Their retention varies and ranges between 31 days and 2 years, matching the retention of events in the underlying logs. Logs are kept for 90 days for resources used by Application Insights.
- Traditional guest OS metrics: The Windows diagnostic extension or the Linux diagnostic extension gathers these performance markers and sends them to an Azure Storage account.
Platform metrics are kept for 93 days for most Azure resources, as was already mentioned. However, when using the Metrics tile, you may only request a maximum of 30 days’ worth of data for any given chart. Log-based metrics are not subject to this restriction.
Check if the time picker’s start and end dates don’t differ by more than 30 days if your chart is blank or just partially showing metric data. You can move the chart to see the entire retention window after choosing a 30-day window.
For more insights into Azure monitoring, seek guidance from the experts at Awsom LLC.