
Azure Network Watcher
In an on-premises network, it is possible that configuration errors can lead to issues that are challenging to locate and resolve. Similarly, connectivity problems may arise when we design a sophisticated and adaptable Azure arrangement connecting numerous virtual machines (VMs). In this instance, the network watcher assists us in identifying and resolving the problem at the network scenario level.
What is Azure Network Watcher?
Azure Network Watcher is a service that provides deep diagnostics of your Azure virtual networks. It gives you real-time insights into application performance, traffic patterns, and health. Network Watcher runs as an agent on every virtual machine in your virtual network.
Using Network Watcher, you can:
- Analyze the performance of your applications, including CPU, memory, storage, and bandwidth usage.
- Monitor traffic flows through each subnet in your virtual network using network flow logs.
- Identify potential problems with your virtual network topology by viewing live state information for all virtual machines in your subscription.
Monitoring Elements of Azure Network Watcher
An Overview of Virtual Network Resources and Their Relationships
It becomes increasingly challenging to comprehend what resources are in a network and how they relate to one another as there are more resources in a virtual network. Using the network topology capabilities, you can create a visual diagram of the resources in a virtual network and their connections. The topology of a virtual network with two virtual machines, three subnets, public IP addresses, network interfaces, route tables, network security groups, and connections between them is shown in the accompanying image.

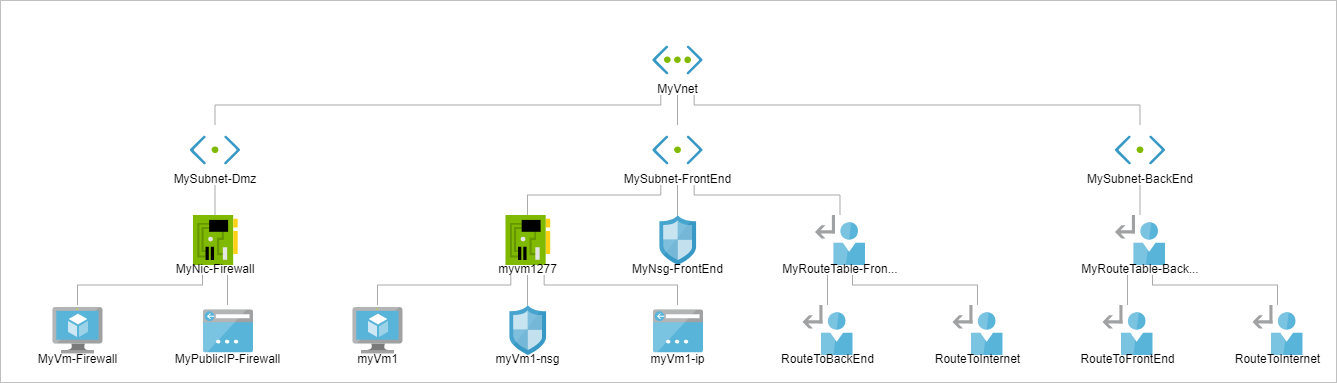
Communication between an Endpoint and a Virtual Machine
Network Watcher keeps track of various endpoints, including IPv4 addresses, fully qualified domain names (FQDNs), and virtual machines (VMs). Reachability, latency, and network topology changes are communication-related metrics that the connection monitor tracks between two endpoints.
For instance, a VM running a website might need to communicate with another VM hosting a database. Connection Monitor alerts you whenever a network security rule or new route is implemented that prevents this communication and provides the cause. Additionally, you can utilize Connection Monitor to schedule a connection test.
Diagnostic Elements in Network Watcher
When you open the Network Watcher, you see all the diagnostic elements that are part of the virtual network gateway. You can use this information to troubleshoot problems with virtual networks and connections.
Diagnose routing problems for VMs
Network Watcher lets you view the network traffic between your VM and the Internet. This includes packets sent to or received from the Internet and between other resources on your virtual networks, such as other VMs, websites, or databases. You can use this feature to see if any packets are being dropped or blocked due to configuration issues with your virtual network.
Capture Packets to and from a Virtual Machine
You can use Network Watcher to capture traffic between a virtual machine (VM) and an endpoint on the Internet or within your Azure subscription. To capture packets, you must first create an experiment. You can start capturing packets by selecting the Experiment object in Network Watcher. After you’ve captured packets for your investigation, you can analyze them using other tools such as Wireshark or Microsoft Message Analyzer (MMA).
Recognize a Virtual Machine’s Network Traffic Filtering Issue
Multiple default security rules that allow or disallow traffic to or from a virtual machine are applied by Azure when it is deployed. The default rules can be changed, and you can add new ones. You can define a resource and destination IPv4 port, address traffic direction, and protocol using the IP flow validates capabilities.
Examine Virtual Machine’s Outgoing Connections for Problems
You can test the connection between two virtual machines, a URI, an FQDN, or an IPv4 address using the troubleshooting capabilities. The results of this test are identical to those obtained when connection monitor functionality is used.
Automated Network Watcher Activation
When you create or upgrade a virtual network, Network Watcher is automatically active in the region of your virtual network. The Network Watcher’s automatic activation unaffected your linked fee or resources.
Metrics
Within an Azure subscription and region, there are restrictions on the number of network resources you can establish. If the limits are reached, you won’t be able to add further resources to the subscription or region. A summary of the number of each network resource that has been deployed in a subscription area, as well as the resource’s limit, is given by the network subscription limit capability. The partial outcome for network resources deployed in the East US region for a sample subscription is shown in the following image:

Features of Azure Network Watcher
The following are some of the key features:
Flow Logs
The flow logs feature lets you see all communications between your clients and servers on your network. This is useful for monitoring traffic patterns, identifying potential security threats, and more.
Troubleshoot Connection
In cases where a user can’t connect to certain servers or services on the network, Network Watcher can help you troubleshoot their issue by displaying information about the problem in real-time. This includes details like what server they’re trying to connect to, what port they’re using, and more.
VPN Diagnostics
The VPN Diagnostics feature lets you troubleshoot problems with your VPN connection. It shows you details about each hop in your connection path and helps you identify problems with the VPN server or client software and configuration issues on either side of the connection.
Visualize the Network Topology
Network Watcher contains a graphical view of your organization’s Active Directory infrastructure that shows how it’s organized at a high level. You can use this view to ensure everything is connected properly before deploying new services or making changes to existing ones; it also makes troubleshooting easier if something goes wrong.
Wrapping Up
For troubleshooting and identifying network issues in your environment, the Azure Network Watcher is a great tool. Utilizing the different components does have a cost, even though the resource enabling is free. To keep expenditures in check, plan appropriately for log maintenance or the quantity of diagnostics run. You now have the tools necessary to re-enable the Network Watcher resource in case you unintentionally disabled it. To know more about Azure Network Watcher and how to implement it, consult with a team of experts at Awsom LLC.